Fear & greed, with the reasoning
Know how the market feels.
And why.
Three markets — the US, Europe and Asia — each in one 0–100 number, with each day's news read, reasoned, and independently verified into a plain-language account of what moved it.
Free to install. No account, no ads. iPhone, iPad and Apple Watch, iOS 18 and later.
Inside the app
The number, the reasoning, and the receipts behind it.
-
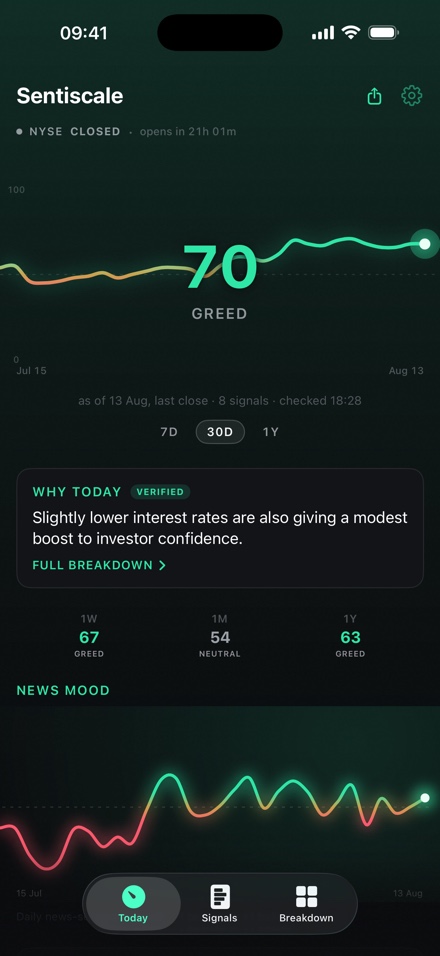
TodayOne number, the line it came from, and why it moved. -
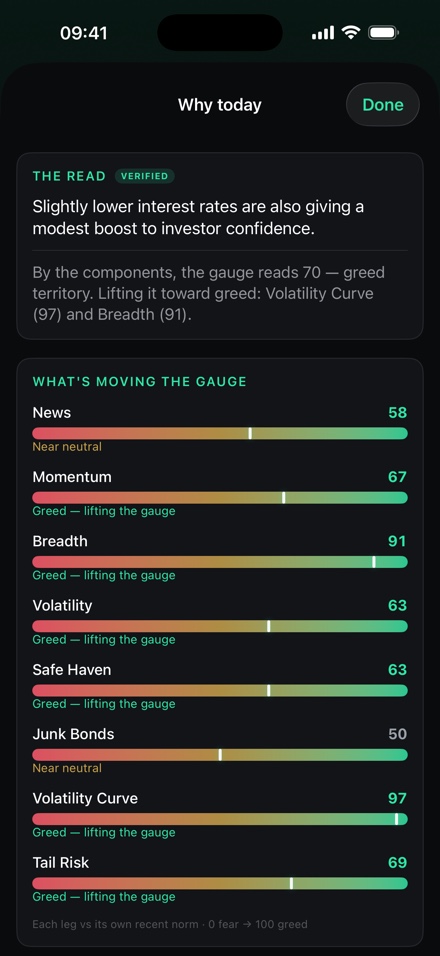
The readWritten, then independently checked before you see it. -
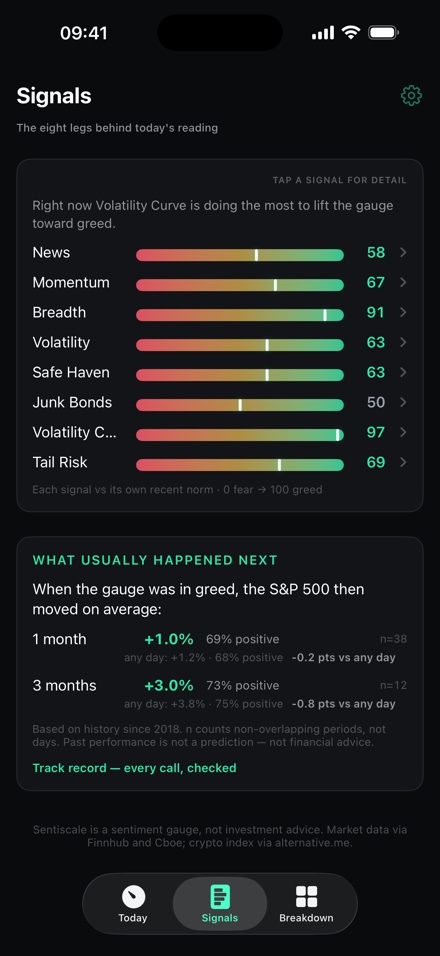
SignalsThe eight legs, and what usually happened next. -
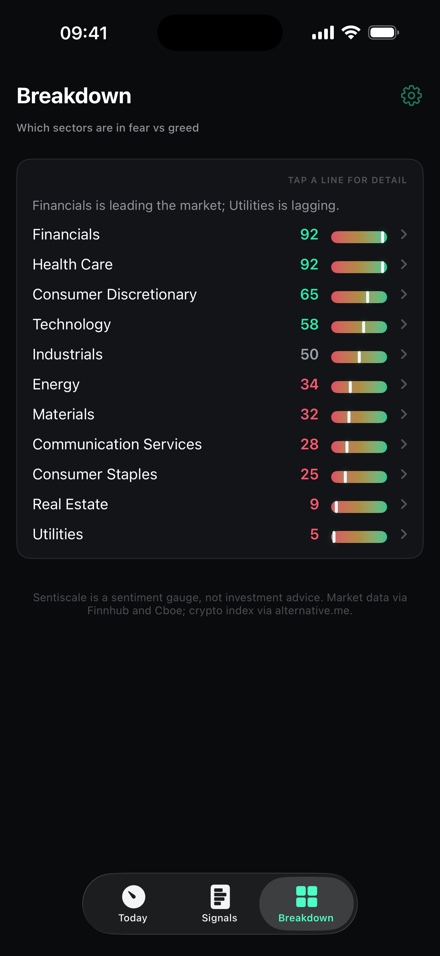
BreakdownWhich eleven are leading, and which are being left behind. -
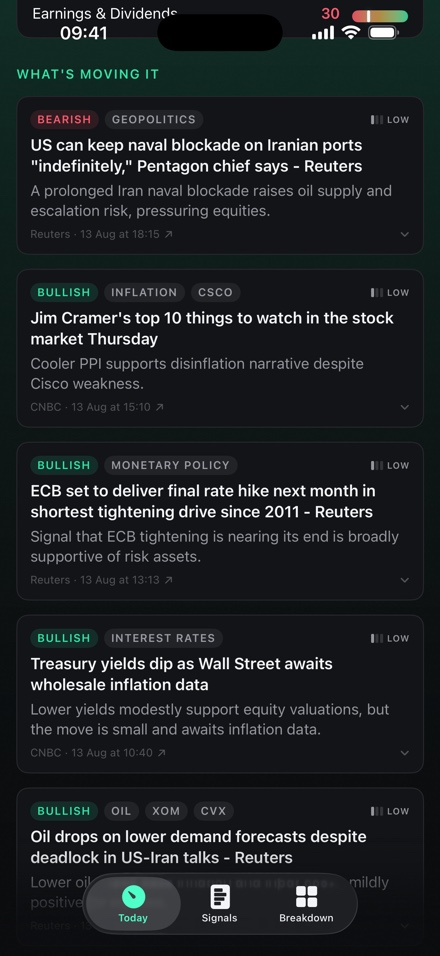
The headlinesEvery story scored, with the reason it moved the gauge. -
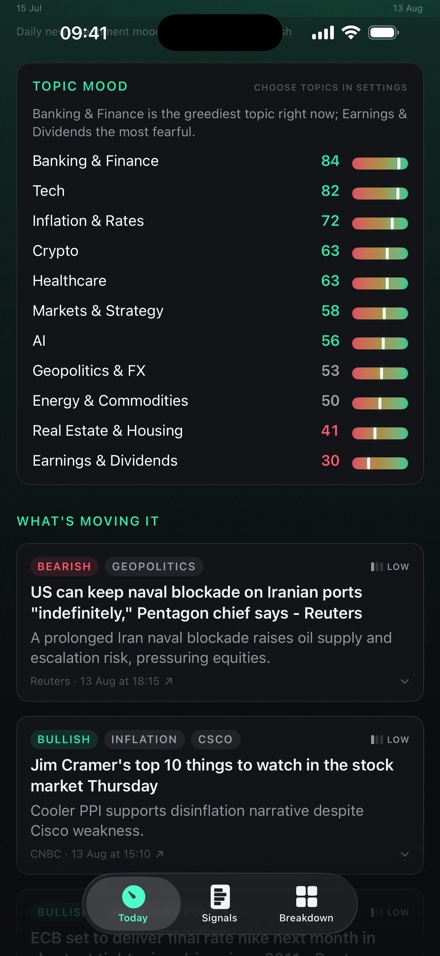
By topicWhere the fear actually sits, across eleven themes.
One number, eight signals
It reconciles what the market says, does, and fears into one honest number.
Most gauges watch price and nothing else. Sentiscale fuses eight independent signals — the day's news, the market's trend, how broadly the average stock participates, and five reads on volatility and where money is hiding. Each is scored against its own recent history and weighted equally, so no single noisy input runs the gauge.
The same breakdown lives in the app — tap any signal to see exactly what it's reading right now, in plain language. Europe and Asia run the same method on eight signals apiece, each read against its own market's instruments.
What's behind it
US · exampleOne method, three gauges
The US, Europe and Asia — each read on its own terms.
A gauge that reads Europe through American instruments isn't reading Europe. Every region gets its own volatility complex, its own credit spread and its own breadth — scored against that market's history, never a translated US number. Switch markets in the app; the daily verified “why” follows.
Eight signals
Fear priced three ways, not one.
- The VIX, its three-month curve, and Cboe SKEW — three separate reads on fear.
- Breadth counted across the eleven sectors, so a handful of megacaps can't fake a rally.
- The only gauge with a news leg scored into the number itself.
Eight signals
Read with Europe's own instruments.
- VSTOXX and its three-month curve — Europe's own volatility complex, not the VIX.
- A financials leg: banks lead this market in a way they never lead the US.
- Inputs deflated by ECB reference rates, so a euro move never reads as sentiment.
Eight signals
Japan and China, never averaged together.
- Japan and China read as separate poles, so a Tokyo rally can't hide inside regional weakness.
- A semiconductor leg — the cycle the region actually turns on.
- A plain-language rotation line: which market is leading, which is lagging.
Where the numbers come from
Free, public market data — read, scored, and checked.
No paid terminal and no private feed. Every input is public data that Sentiscale reads, normalizes, and fuses on a schedule through the day.
Public market data
The S&P 500, long-dated Treasuries and the eleven sector ETFs the breadth leg counts stream from Finnhub. The VIX, its three-month curve and the Cboe SKEW index come straight from Cboe's public end-of-day files; the European gauge reads VSTOXX and its three-month curve from STOXX's own published history. Every region's credit leg reads the actual ICE BofA high-yield spread published by the St. Louis Fed — the spread itself, not an ETF price ratio standing in for it. The European and Asian gauges deflate their inputs with ECB reference rates, so a currency move never reads as sentiment.
A model reads every headline
A language model scores each story for sentiment, confidence and relevance, then weights it by likely market impact — so one pivotal report outweighs a dozen fillers.
Each signal vs its own history
Every signal is measured against its own recent norm and mapped onto one 0–100 fear–greed scale, then weighted equally into a single number — so no one leg dominates.
Drafted, then fact-checked
One model writes the plain-language “why” from the day's drivers; a second, independent model checks every claim against its sources and drops anything unsupported.
Market inputs feed the gauge only — Sentiscale is a sentiment tool, never a quote feed.
Alongside the gauge
Two readings that don't belong inside the number.
Both sit as their own cards in the app. Neither is folded into the gauge — a signal that moves with the market rather than ahead of it earns a place on the screen, not a vote in the score.
What people search when they're scared
How hard the public is searching for a crash — stock market crash in the US, Börsencrash in Germany, 株価 暴落 in Japan — charted against its own recent range. Each market gets the term its own crowd actually types. High means the crowd is frightened, and it is the one reading here that comes from people rather than prices.
The crypto fear & greed index, charted
The community index from alternative.me, no longer a bare number: a full history you can scrub from a day out to a year, on the same 0–100 scale as the equity gauge, so the two moods can be read side by side.
The difference
A gauge is easy.
Telling you why is the hard part.
Most meters stop at a number. Sentiscale reasons over the day's news to explain what moved the mood — and a second, independent model verifies every claim before it reaches you.
- One model drafts the explanation; a second, independent model verifies it.
- Every claim is cited to the exact headlines behind it.
- Anything its sources don't support is dropped — it never speculates past the evidence.
A measured edge — shown honestly
When the gauge has been here before, here's what came next.
No promises — just the backtested behaviour for the current band, with its real sample size. Over a six-month test, the reading led the market's next move:
Not investment advice A backtest is history, not a forecast — information, not a recommendation to buy or sell.
Always one glance away
On your lock screen.
Quiet until it matters.
Pin the gauge to your lock screen. It updates through the day and only interrupts you for an extreme swing or a real market-mover.
- A self-refreshing lock-screen widget.
- Impact-gated alerts — no headline spam.
Free, with a Pro tier
Start free. Go deeper if you want the why.
Free
Forever- The live 0–100 mood gauge
- The lock-screen widget
- Extreme fear & greed alerts
Pro
Proor $19.99 a year — 7 days free either way.
- Everything in Free
- The daily “why” — reasoned and verified
- Citations: the headlines behind every claim
- The backtested band signal
- Per-sector mood breakdown
Prices in US dollars. Your own storefront’s price is shown in the App Store before anything is charged.
Out now
Today's reading is already waiting.
Free on the App Store. The gauge, the widget and the alerts cost nothing — the reasoning behind the number is what Pro adds.